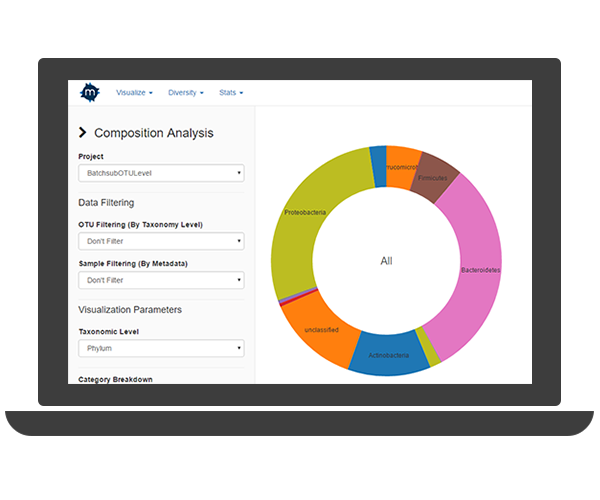
Easily see trends and patterns in the form of bar charts, scatterplots, PCA, NMDS, composition pie charts, tree plots, and more.
View key alpha and beta diversity results in the context of gene expression, host response, or any other related metadata.
Quickly run basic data mining packages like elastic net, Fisher's exact test, and more.
Find relationships between changes in the microbiome and changes in the immune cell infiltration, gene expression, or other measured response.
Pick and choose to use different levels of filtering of your data.
Research should be accessible to everyone, always.
Get meaningful results by automatically or manually subsampling the microbiome data.